Using R & Shinyapps.io to close the K-12 connectivity gap
 Evan Marwell / Evan Marwell, Founder and CEO
EducationSuperHighway is the leading non-profit focused on upgrading Internet access in every public school classroom in America. Our data-driven programs help accelerate upgrades in America’s schools. We catalyze federal and state action on K-12 broadband initiatives, get fiber to schools that need it, and make broadband more affordable for school districts.
"Our Shiny app is one of my most visited sites internally. I rely on Shiny for meeting preparation, to stay up-to-date with our ever-changing dataset, engage with our team to find the most interesting insights and, ultimately, achieve our mission by 2020.”
- Evan Marwell, Founder and CEO, EducationSuperHighway
We rely on data-rich and highly analytical reports to compel state government officials, especially governors, to take action to upgrade schools. With 50 states to report on, we were spending a significant amount of time generating individual metrics and creating unique visualizations that should have been standardized.
We wanted to replace duplicative work with a dynamic tool that would be usable across internal teams and visually appealing.

In seeking to deliver this, data analysts Sujin Oh and Jess Seok, discovered Shiny. They quickly found that Shiny would let us iterate more quickly, provide reliable data insights, and improve the transparency of the data exploration phase. The flexibility of Shiny has also increased our organization’s capacity to identify and share analytical insights. For example, prior to Shiny, production of map visualizations were limited to those in our organization who knew how to use R. With Shiny’s download functionality paired with the ggplot2, leaflet, and tigris packages, anyone at our organization can curate their own investigation into the data and readily export figures and maps for presentations.
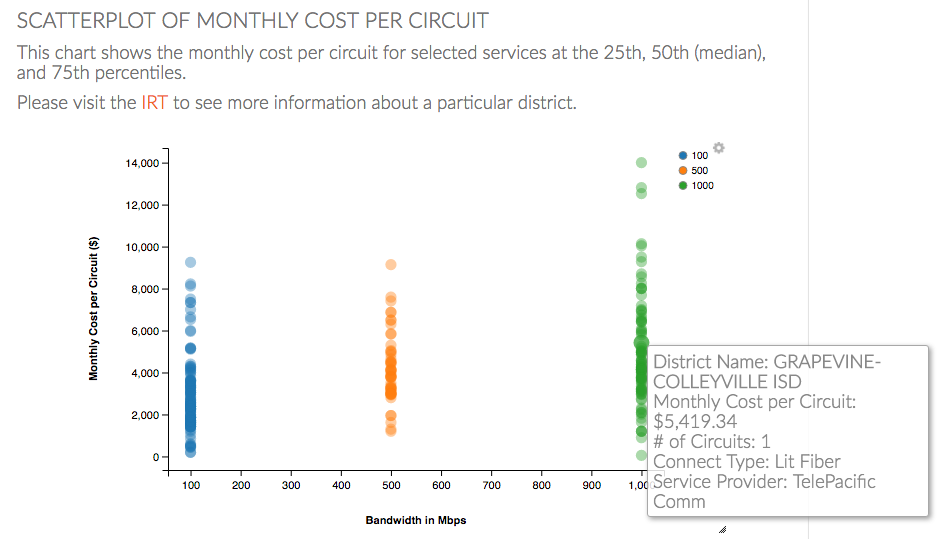
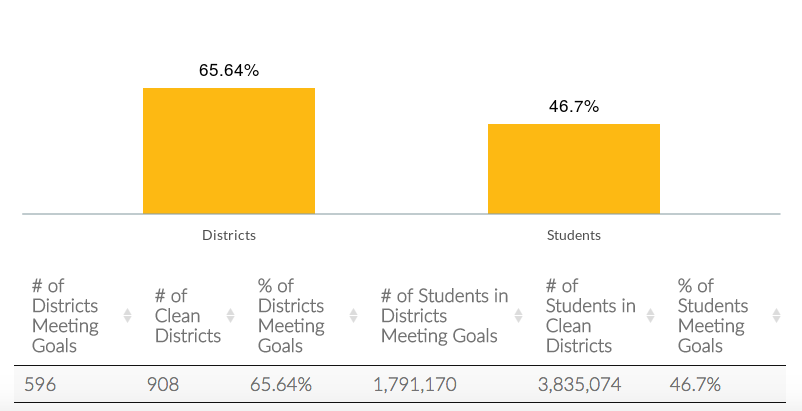
Key metrics that we now explore through Shiny include:
R is the language of choice for those at EducationSuperHighway who work with data. We regularly use packages that were developed by the RStudio team, such as ggplot2, markdown, tidyr, and dplyr. When we were looking to deploy our analyses to a web format, it was natural that we turned to RStudio products to achieve our goal. We appreciate all that RStudio provides to the R community and are excited to be part of it.
As a nonprofit, it can be challenging to find solutions that are both cutting-edge and affordable. Shinyapps.io was an extremely affordable option that still allowed us to do everything we wanted to do with Shiny.
Shiny enables us to work more efficiently and collaboratively as well as deliver analytical products in new and exciting ways. We are able to produce our data products more quickly, allowing the team more bandwidth to develop new analytics. Shiny also benefits the team by allowing standardization of our statistics across all states, which helps the organization be consistent and efficient. Lastly, teams within the organization that are less familiar with R are able to gain tremendous insights into the data that they may never have had before and allows everyone in the organization to be on the same page. All of these benefits are paramount to the organization achieving its mission by 2020.
RStudio provides open source and enterprise-ready professional software for data science teams using R and Python.